Pexus X-Deep/32 X Server Software on Windows 8 Preview

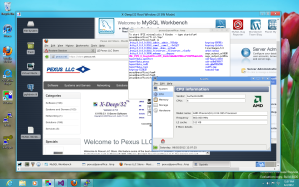
Installed Windows 8 Preview by upgrading Windows 7 system. The upgrade went smooth. The new Windows 8 Preview looks great with a switchable metro style and the familiar desktop style interface.  Test installed Pexus X-Deep/32 X-Server software on Windows 8 Preview. The current version 4.7 install ran fine unmodified. After install run X-Deep/32 X-Server software once as an Administrator to register the software trial / registered license. The software came up fine without any problems. Attached a screen shot of X-Deep/32 software running XFCE4 desktop connected to Ubuntu 10.04 LTS server.

You can easily order X-Deep/32 from our online store  or download an evaluation copy by clicking this link.

X-Deep/32 on Windows 8 Preview release

Splunk and J2EE application logging – Part 1

All  modern J2EE application are distributed in nature and typically involves web servers, application servers, database servers etc. . Diagnosing application problems in a distributed environment is challenging. Tracing problems as application requests and transactions  traverses across the distributed components whether it is the web server, application server, database components is always time consuming and requires quite a bit of application knowledge. A number of monitoring tool software have promised the holy grail of transaction tracking and diagnosis but have largely failed. A lot of monitoring tools end up with large dashboards with red, yellow and green markers that just indicates if the system is running fine or has issues but not enough information to diagnose them quickly. Enterprises spend millions in licensing costs to monitor these distributed components only to spend more money on additional resources to diagnose and fix them. Most of monitoring tools end with operational teams that lack the deep knowledge to diagnose application problems quickly.

My years of experience diagnosing problems have helped me realize that to diagnose problems quickly one has to resort to application logs, stack traces, debug traces and some deep knowledge of application.  Deep application monitoring tools such as Wily, ITCAM for  Application Diagnostics etc. do offer deep instrumentation but have very high performance overheads when they are turned on always. Despite their deep tracing capabilities they still fall short of correlating the individual requests to provide meaning full insight to resolve problems quickly.

All application components have some kind of logs but obtaining the logs for application diagnosis from disparate systems and correlating log entries is a time consuming process.

Splunk log monitoring tool helps you search log files spread across disparate systems and organizes the results chronologically, by hosts, by log types etc., but by itself is not sufficient to help you correlate the log entries.  Splunk tool offers a slightly different approach to application problem monitoring by helping scan application logs for error symptoms. However Splunk does require some prior knowledge of application exception handling  and common error strings to look for. While Splunk is extremely powerful in scanning logs and displaying the log searches chronologically that can span the various distributed components, it still falls short of correlating them unless the application provides some unique identifier to tie the logs together.  Building a logging framework that can be shared by the distributed application will help application diagnosis immensely.

All modern application frameworks provides some kind of mechanism to add filters to application requests or you can leverage aspect programming patterns to add contextual information as requests pass through the different layers of your application. Caching application traces for requests and printing them when requests exceeds response time threshold can greatly aid in application diagnostics.

I will be talking about such an implementation in Part 2 of this series, that leverages the Splunk deployment in our application infrastructure to enhance the performance and application diagnosis process.

 

WebSphere Portal and JSF Memory Woes

If you use WebSphere Portal and JSF (Java Server Faces) and having issues with memory, garbage collection and slow performing Portal then you may want to review your JSF settings in your web.xml.  JSF is known to be a memory hog. By default it maintains 15 view states on the server side. These states are stored in user session and may last considerable amount of time on applications that require users to be logged in for the complete work day schedule. We found out on a typical 2GB heap size JVM, about 800 MB of memory is held by these JSF view states.  You can configure the number of “view states to save” in your web.xml file of your portal application.

Check out this tech note on details on changing the default number of view states saved from 15 to a lower number.   – https://www-304.ibm.com/support/docview.wss?uid=swg21424426

We set  the number of view states  to 2 (from the default 15) and were surprised to find the reduction in session memory from 800 MB to to about 200 MB over 6-8 hour period. That was considerable savings on memory.

You can use the IBM Support Assistant – a free tool from IBM that provides a number of JVM problem analysis tool including a memory analyzer that enables you to look at heap dumps, thread dumps, logs etc. You can download this tool from the following location –   IBM Support Assistant

You can use the memory analyzer tool to inspect heap dumps  before and after changing this configuration and compare the memory usage by the key erring class that keeps the memory in session –  com.sun.faces.util.LRUMap. Attached are some screen shots on our findings.

Data using the default view states of 15:

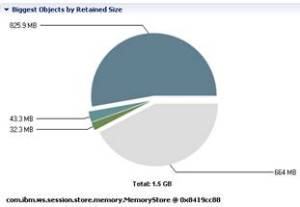
Heap Distribution and com.sun.faces.util.LRUMap instance data

– Notice about 800 MB chunk of heap data that is attributed to com.sun.faces.util.LRUMap classes instances

Heap Data with default number of view states - 15
instances and memory held by com.sun.faces.util.LRUMap  class
Instances and memory held by com.sun.faces.util.LRUMap class with default view states - 15

Data using the view states set to 2:

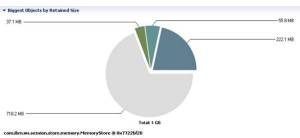
Heap Distribution and com.sun.faces.util.LRUMap instance data

– Notice that the amount of memory held has now come down to about 200 MB

Heap distribution with JSF states set to 2
Instances and memory held by sun.com.faces.util.LRUMap with JSF states set to 2

BigBlueButton

Ever wanted host your own application like  DimDim, GoToMeeting etc. to share and collaborate with your teams on demand and not pay any subscription fees ? Look at  the free open source alternative – BigBlueButton. If you have a Linux Server lying around, accessible on the internet or an Amazon EC2  account and a little savvy with Linux you could potentially host your own for almost free !

Leverage Putty, X-Deep/2 X-Server and XFCE4 for minimalistic X window experience on Linux Servers

This X-Deep/32 X-Server FAQ talks about how you can leverage free Putty tool and minimalistic X Window package XFCE4 that you can install on Linux Servers such as Ubuntu Server  etc, without overloading you Linux Servers running in a headless environment.  Use with cost effective Pexus X-Deep/32 X-Server solution to access Linux servers securely for common administration tasks right from your Windows desktop. With X-Deep/32 you can start multiple sessions each with it’s own instance of X-Server.

Registering your Suse Linux Enterprise

If you are using Suse Linux Enterprise distribution, it is important you get your updates and patches from Novell to maintain your support and authenticity of your distribution.

Each distribution has it’s own quirks and if you have worked with a different distribution such as Red Hat, CentOS or Ubuntu, it takes a while to get around and be familiar with the updates, patches, repositories etc.

Novell has 3 distributions that may be useful for enterprise customers. Novel SLE JEOS (Suse Enterprise Linux Just Enough OS – slimmed down OS), Novell Suse Linux Enterprise (SLE) Server/Desktop and Novell Suse Linux Enterprise for VMware.

There is a new tool called  zypper that lets you register and manage your updates and patch levels.

To register your product (applies to Novell Business Partners). you will have to get an activiation code.  Login to your Novell site and based on your entitlements, you can obtain the registration code. Use the following command to register your SLE and refresh your zypper environment.

suse_register -a email=your_email -a regcode-sles=your_registration_code

zypper refresh

After registration list the update repositories that are added to your zypper environment.

zypper lr


For more information refer:

http://support.novell.com/techcenter/articles/RegandUpdate_SLE10.html

http://www.novell.com/documentation/sle_jeos10/pdfdoc/sles_10_jeos_guide/sles_10_jeos_guide.pdf


Configuring Suse Linux Networking manually

Networking is the first thing you would do after installation of a Linux OS (for that matter any system OS). If you are dealing with a server, chances are you don’t have a GUI at hand. Most Linux distributions have different utilities to handle network configuration.  Here are links to Novell Suse Enterprise Linux documentation.

All  Novell Docs -> http://www.novell.com/documentation/index.html

SLE11 Network Configuration Link -> http://www.novell.com/documentation/sles11/book_sle_admin/data/sec_basicnet_manconf.html